
Over the course of the past few weeks, I have been looking into Splunk and Kibana. This post isn’t a comparison of the two, but there are several posts covering this topic. Splunk is a great alternative and has a host of features that are unfortunately missing from Kibana. There is a really nice Free Fundamentals Course offered by Splunk if you are interested in learning about it and how it works.
Based on cost and the work that I am currently looking into, I decided to focus my efforts on Kibana. The goal of this post is to provide you with a Python ElasticSearch-DSL template script that you can use when querying Kibana.
This post will cover the following:
- What is ELK?
- Running Python in Windows
- Connecting to an installed instance of Kibana
- Simple Python ElasticSearch Script
- Some useful resources to help you along the way
If you are not interested in the theory and the Windows Setup, you can skip towards the end where the script is.
What is Elk?
ELK stands for Elasticsearch, Logstash, and Kibana, although it is often just referred to as Elasticsearch:
- Elasticsearch – a NoSQL database which uses Lucene search engine (log searching).
- Logstash – It is a pipeline used to populate Elasticsearch with data (data router and data processing).
- Kibana – It is a dashboard working on top of Elasticsearch which can be used for data analysis (data visualisation).
The combination of the 3 technologies is called ELK stack. If you want to interact with it on a more visual basis, Kibana makes use of a query language called Lucene query syntax which replaced Kibana’s legacy query language. I don’t want to bore you with the details surrounding ELK, so I’m just going to cover the following two areas that I feel are important.
The Discover Tab in Kibana is where you can perform general queries and inspect the data that is coming in from the logs – if you are using the full ELK stack, then the agent will be the Logstash agent that you have set up.
The Visualisation Tab is where you will be able to fine grain your queries through the use of Buckets and Metrics. Visualisations in Kibana are very powerful as they allow you to group data elements together and output them in a format that suits you, whether this is in the form of a table or charts related to the data that you are accessing.
Running Python in Windows
Depending on the Operating System (OS) you are running, you will need to install Python. Because I wanted to try something new, I decided to set Python up in a Windows VM – This post will cover the process involved, as well as how to get your Python instance up and running to query Kibana data through Elasticsearch. We need to start by installing Python. Navigate to Python Downloads and download a version from the latest Stable Releases. When installing the software, unless you want to add it to your path yourself, I would recommend ticking the “Add Python 3.8 to PATH” shown below, which takes care of it for you.

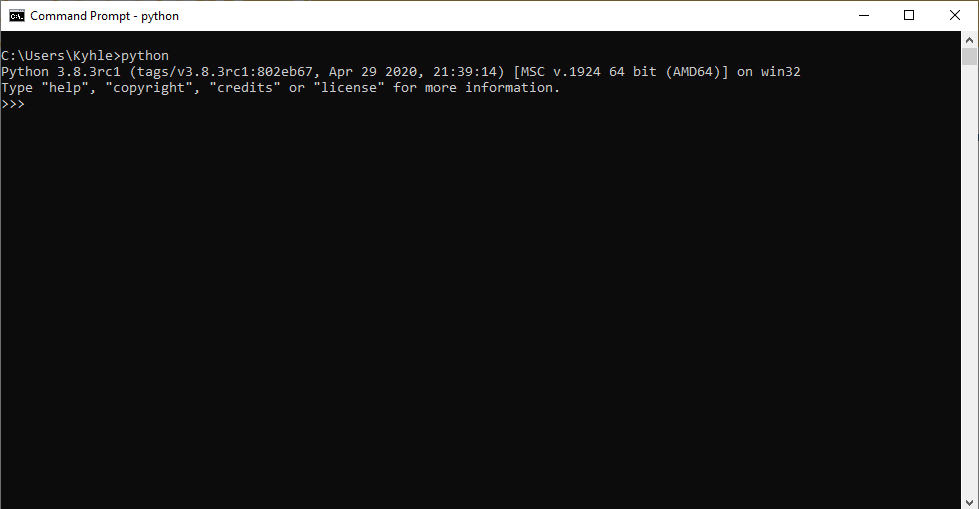
Once installation has completed, you should be able to run Python from the command line by typing python as shown below:
From this point on, it is assumed that you have an instance of Kibana that you are able to connect to in order to retrieve data. In order to get the Python elasticsearch-dsl up and running, you will need to install some Pip modules first. I’m not sure if all of these are relevant for your instance - but these are the modules that I’ve needed while playing around with ELK:
- wheel
- elasticsearch_dsl
- elasticsearch
- elasticsearch5
- pytz
- jira
- datetime
- requests
- argparse
You can add them to a text file and use pip3 install -r requirements.txt in command line. Note - if you are using a system proxy like I was, you either need to turn the proxy off, or add it using the –proxy flag to prevent the connection to pypi from timing out.
Before we begin with the python script, you should run following curl command: curl -XGET localhost:9200 to determine whether you are able to connect to your Kibana instance from command line if you are hosting it locally, otherwise replace localhost with the relevant URL. This step will be essential to ensure that you will be able to connect your Python script to the instance. The output should include information similar to below:
1
2
3
4
5
6
7
8
9
10
11
12
13
{
  "name" : "kibana-instance.cluster",
  "cluster_name" : "my-cluster",
  "cluster_uuid" : "Some UUID",
  "version" : {
    "number" : "5.6.10",
    "build_hash" : "b727a60",
    "build_date" : "2018-06-06T15:48:34.860Z",
    "build_snapshot" : false,
    "lucene_version" : "6.6.1"
  },
  "tagline" : "You Know, for Search"
}
Creating your first Python Script:
Now that everything is set up, we can start working on the script which uses elasticsearch-dsl. Elasticsearch-dsl is a high-level library that leverages the power of ElasticSearch and Python to create queries, buckets, and metrics in a simple manner. It is similar to using the Visualisation Tab in the Kibana frontend. When trying to create a python query, you should first ensure that it is possible to retrieve the data from the Kibana frontend. Your Kibana query might look something like this:
The query shown above makes use of a wildcard (*) which allows it to search through all of the data field while filtering by the field, Some_Field. In this basic script, we are going to create a main function which takes in parameters, searches for Some_Field and provides basic output:
1
2
3
4
5
6
7
8
9
10
11
12
13
14
15
16
17
18
19
20
21
22
23
24
25
26
27
28
29
30
31
32
33
34
35
36
37
38
39
40
41
42
43
#!/usr/bin/python3
import argparse
import elasticsearch
from elasticsearch_dsl import Search, Q, A

def query_script(time_period):
    es = elasticsearch.Elasticsearch(
        "localhost:9200",
        timeout=60
    )

    basic_query = Search(using=es, index="some_index")

    # This will change the timerange that you are searching through
    basic_query = basic_query.query(
        Q('range', inserted={'gte': 'now-' + time_period, 'lte': 'now'})
    )

    # match_all is a wildcard in this instance where you want all the data returned for a specific field
    basic_query = basic_query.query(
        Q("match_all",field="Some_Field")
    )

    basic_query_results = basic_query.execute()
    return basic_query_results

if __name__ == "__main__":

     # Parse arguments - This is optional, can add as many user inputs as you would like
     parser = argparse.ArgumentParser()
     parser.add_argument("--range",required=False, help="choose to override default date in DAYS e.g. --range 30d")
     args = parser.parse_args()

     if args.range:
          time_period = args.range
     else:
          time_period = "7d"

     basic_query_results = query_script(time_period)

    # Returns the 10 most recent results
     for result in basic_query_results:
         print(str(result.Some_Field))
Remember I mentioned Buckets and Metrics above, you can add those checks into the script as well, however that is out-of-scope for this basic script. You will notice that there are parts of the script that use shorthand notation in order to interact with Elasticsearch. The basic shorthands that you will most likely use are:
- Q() - Query, which is included using the
from elasticsearch_dsl import Qimport - A() - Aggregation, which is included using the
from elasticsearch_dsl import Aimport
Something Extra
One thing I realised when initially setting up elasticsearch-dsl was that the queries would only return the 10 most recent results, as detailed in this Github Post. Now why is this the case? The query can return a lot of data and by limiting it, it won’t overload the server or your ouput. If you want to return all of the results you need to explicitly request it, and the simplest way is to slice from zero to the total number of hits (i.e. search.count()). A quick method to return all results is shown below:
1
2
3
4
5
total = basic_query.count()
search = basic_query[0:total]

basic_query_results = search.execute()
return basic_query_results
What this does is it counts all of the results which are returned by the query and accesses them in the form of a list. From there you can decide how many results you require in order to satisfy your use case.
This blog detailed some of the steps that I needed to take when starting out with ELK stack on Windows. I hope that it helps someone if they are struggling to get the interaction between Python and their deployment working, and that this can help ease some questions or concerns. I have included some very useful links (imo) that I have found while trying to wrap my head around this topic.
Useful Resources
Kibana:
Lucene Query Syntax:
- https://www.elastic.co/guide/en/elasticsearch/reference/5.6/query-dsl-query-string-query.html#query-string-syntax
- https://lucene.apache.org/core/2_9_4/queryparsersyntax.html
Elastic Search:
- https://www.elastic.co/guide/en/elasticsearch/reference/5.4/query-dsl.html
- https://elasticsearch-dsl.readthedocs.io/en/7.2.0/search_dsl.html?highlight=bucket
- https://medium.com/@User3141592/understanding-the-elasticsearch-query-dsl-ce1d67f1aa5b
- https://www.tutorialspoint.com/elasticsearch/elasticsearch_quick_guide.htm
- https://logz.io/blog/elasticsearch-queries/