I have been playing with different GCP services recently, including GCP’s Vertex AI. During testing, I was trying to identify the usage of specific LLM model types within my environment through the GCP Logs Explorer which, unfortunately, did not return any results:
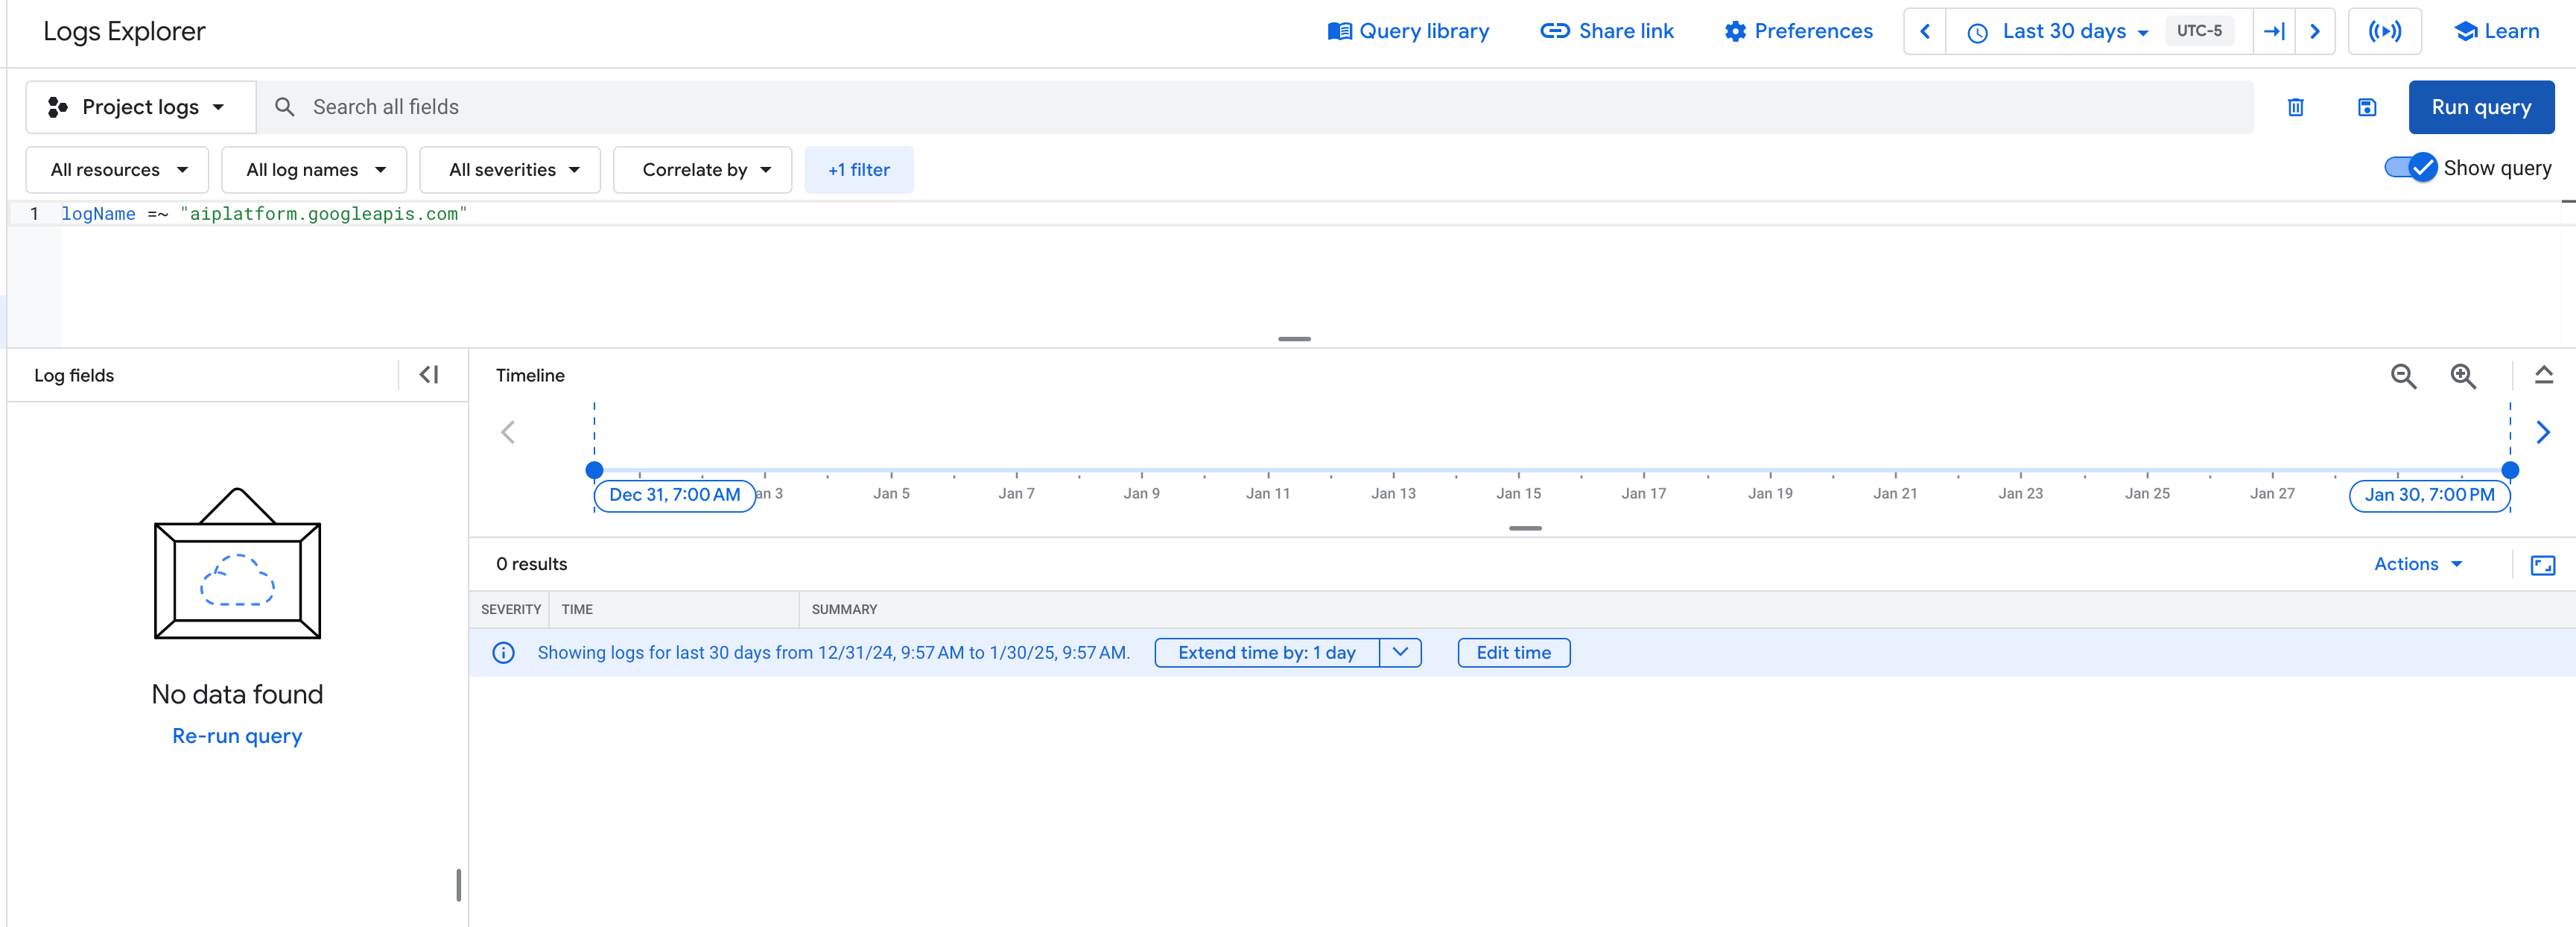 GCP - Logs Explorer
As per Google’s documentation, you need to enable data access logs to view the usage of any data read/write operations which includes usage of the models themselves.
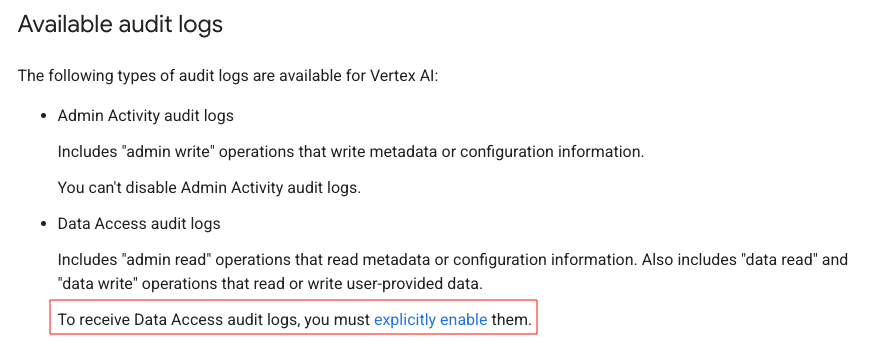 GCP - Audit Log Requirements
This is all expected behaviour but data access logs can be expensive. What if, even without those logs, you wanted to determine which AI models were being used within your environment? Or if you wanted to search for usage of specific models (e.g. deepseek cough* cough*)? Fortunately, Vertex AI has a model observability feature.
Vertex AI Observability Metrics and Monitoring
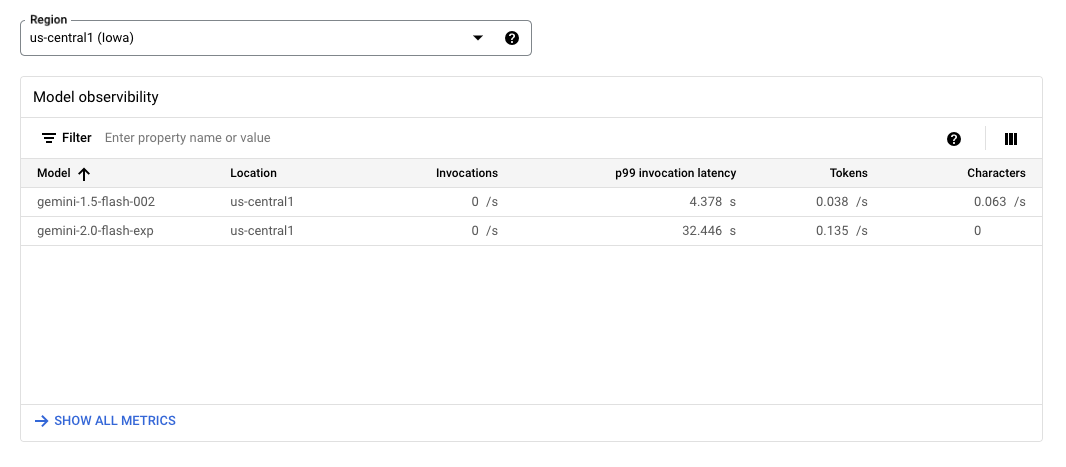 GCP - Vertex AI Model Observability
Using the feature above, you can view the different model invocations throughout your environment for the specified project. If you navigate to “show all metrics”, you can even perform indepth analysis of the usage:
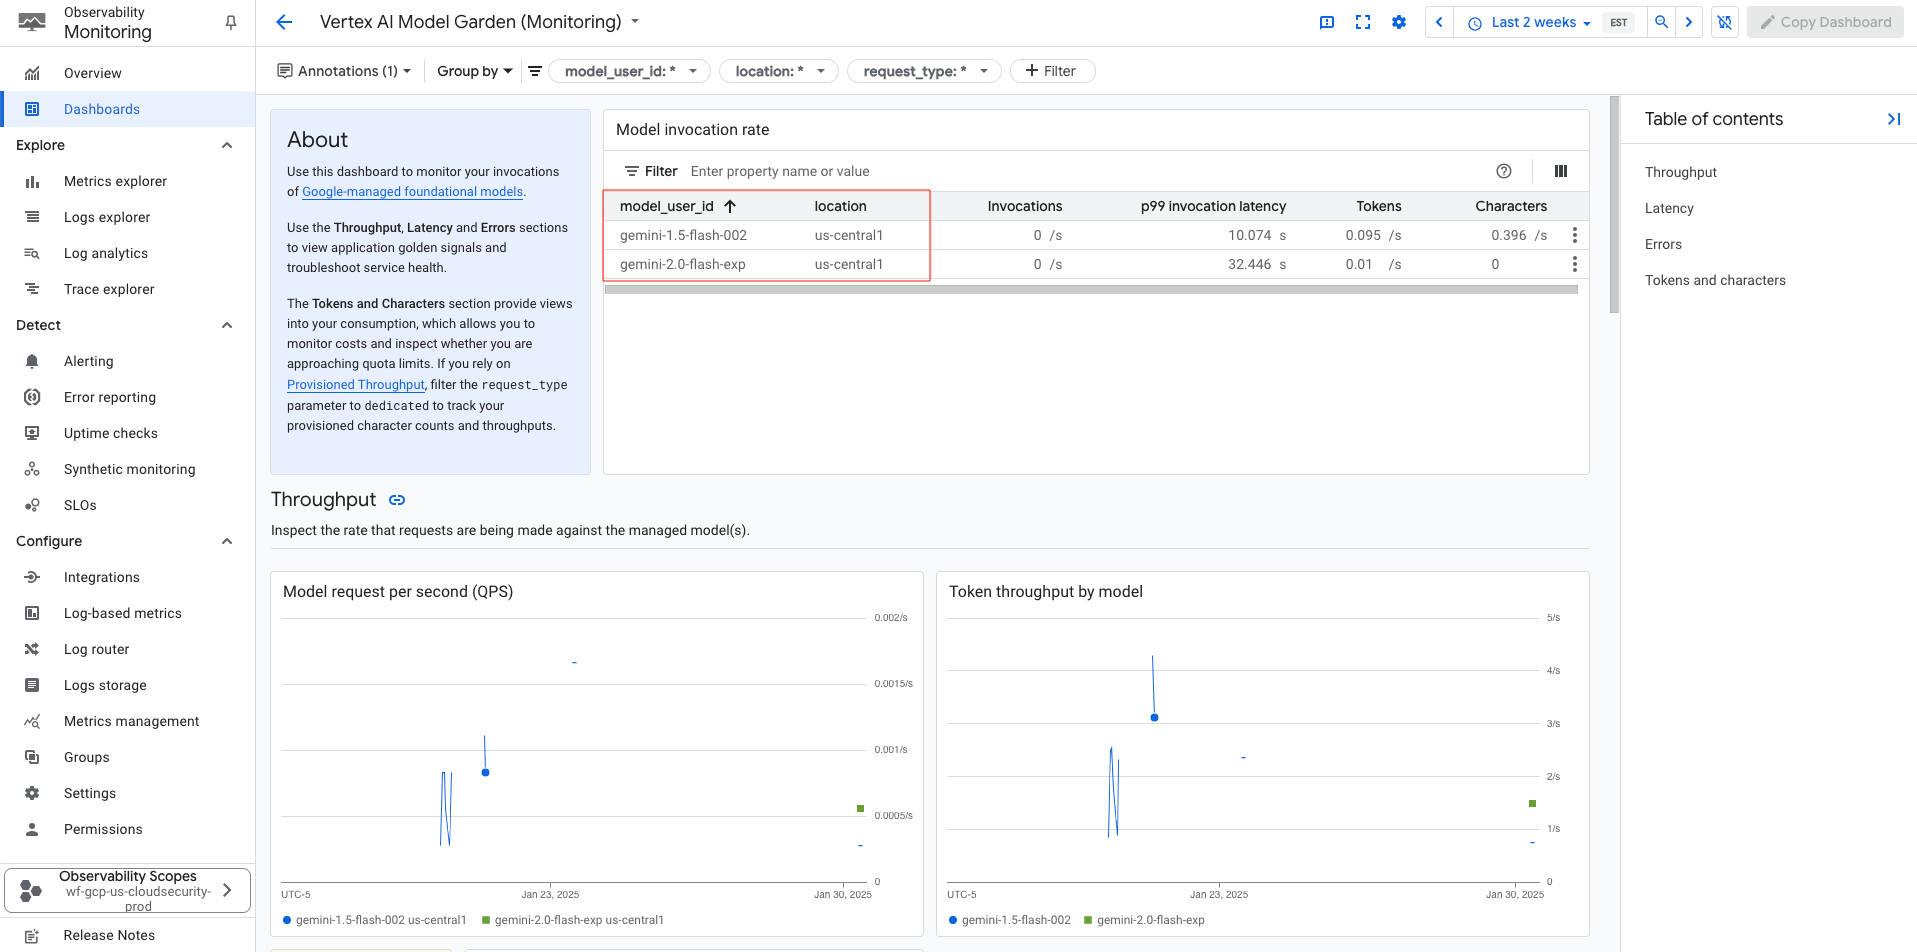 GCP - Observability Monitoring
But, what if you wanted to view the usage across your entire organization instead of on a per-project basis?
- If you had access to billing, you could create a report to view the usage, but that may not be up-to-date based on your requirements as the cost table is generally a month behind.
- If you had control over your environment, you may be able to increase your observability metrics scopes.
- Based on these modified scopes, you may also be able to create a multi-project dashboard within the Observability Monitoring service, however, that requires additional GCP permissions which you may not have:
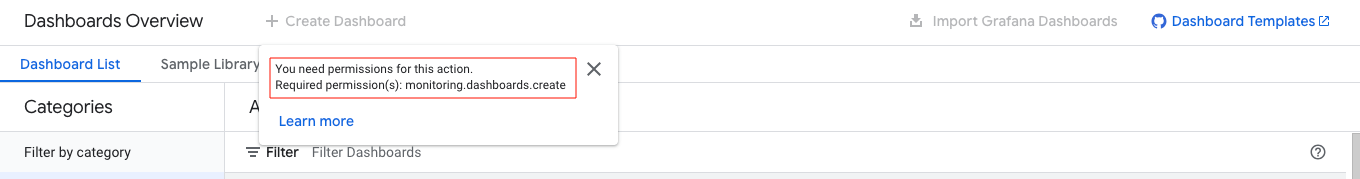 GCP - Observability Monitoring
Google Cloud Monitoring
In order to overcome these obstacles, I started looking into alternative methods to pull the metrics information using time-series fields from the Python Google Cloud Monitoring Client Library. Following the examples in the documentation, I modified the filter string to specifically retrieve publisher model information from the aiplatform.googleapis.com API.
1
filter_str = 'metric.type="aiplatform.googleapis.com/publisher/online_serving/model_invocation_count" resource.type="aiplatform.googleapis.com/PublisherModel"'
The full function that I adapted is provided below, it includes a monitoring interval of 1 day but that can easily be extended for other use cases.
1
2
3
4
5
6
7
8
9
10
11
12
13
14
15
16
17
18
19
20
21
22
23
24
25
26
27
28
29
30
31
32
33
34
# Function to fetch AI Platform metrics for a given project
def get_ai_platform_metrics(project_name):
    project_name = project_name
    # Define the metric type and filter
    filter_str = 'metric.type="aiplatform.googleapis.com/publisher/online_serving/model_invocation_count" resource.type="aiplatform.googleapis.com/PublisherModel"'

    # Define aggregation settings
    aggregation = monitoring_v3.Aggregation(
        alignment_period=Duration(seconds=60),
        per_series_aligner=monitoring_v3.Aggregation.Aligner.ALIGN_RATE,
        cross_series_reducer=monitoring_v3.Aggregation.Reducer.REDUCE_SUM,
        group_by_fields=["resource.labels.model_user_id", "resource.labels.location"]
    )

    now = time.time()
    seconds = int(now)
    nanos = int((now - seconds) * 10**9)
    interval = monitoring_v3.TimeInterval(
        {
            "end_time": {"seconds": seconds, "nanos": nanos},
            "start_time": {"seconds": (seconds - 86400), "nanos": nanos},
        }
    )

    results = client.list_time_series(
        request={
            "name": project_name,
            "filter": filter_str,
            "interval": interval,
            "view": monitoring_v3.ListTimeSeriesRequest.TimeSeriesView.HEADERS,
            "aggregation": aggregation,
        }
    )
    return results
The full version of the python script can be found on GitHub. The processing hasn’t been optimized and it’s not pretty, but it should work in a pinch if you’re looking for a quick method to perform an organization-wide search within your environment! The output is currently in a simple markdown table but that can be modified as per your requirements.
The script uses Application Default Credentials (ADC) for authentication: https://cloud.google.com/docs/authentication/provide-credentials-adc#how-to/
Once the script has run, the markdown table should look similar to the example output provided below:
1
2
3
4
5
6
7
8
9
10
No organization found, checking for projects...
Querying project: brilliant-fish-455131-f3
Querying project: tonal-tide-432421-f3
Querying project: maxim-product-44941-u7

| project_id | model_user_id |
|------------|---------------|
| brilliant-fish-455131-f3 | gemini-2.0-flash-exp |
| tonal-tide-432421-f3 | gemini-1.0-pro-vision-001 |
| maxim-product-44941-u7 | gemini-2.0-flash-exp |
Just a note, if you do try to implement multithreading for the time-series, there is a high likelihood that you will hit a quota limit!
1
2
3
4
5
6
7
8
9
10
11
12
13
14
15
16
17
18
19
20
21
22
23
24
25
26
27
28
29
30
31
google.api_core.exceptions.ResourceExhausted: 429 Quota exceeded for quota metric 'Time series queries' and limit 'Time series queries per minute' of service 'monitoring.googleapis.com' for consumer 'project_number:855506332425'. [reason: "RATE_LIMIT_EXCEEDED"
domain: "googleapis.com"
metadata {
  key: "service"
  value: "monitoring.googleapis.com"
}
metadata {
  key: "quota_metric"
  value: "monitoring.googleapis.com/query_requests"
}
metadata {
  key: "quota_location"
  value: "global"
}
metadata {
  key: "quota_limit"
  value: "QueryRequestsPerMinutePerProject"
}
metadata {
  key: "quota_limit_value"
  value: "6000"
}
metadata {
  key: "consumer"
  value: "projects/PROJECT_ID"
}
, links {
  description: "Request a higher quota limit."
  url: "https://cloud.google.com/docs/quotas/help/request_increase"
}
]
I hope that you have learned something from this post and, as always, feel free to reach out to me with any comments!